Frontend Insight: from error counts to diagnostic context
Follow snapshots, response streams, explicit association, and source mapping through the tradeoffs between diagnostic detail, application behavior, and storage cost.
Frontend Insight is a delivered analytics and quality platform for internal web products. It covers page and feature use, business workflows, efficiency, and quality. This article follows runtime diagnostics: how error statistics become context an engineer can use to investigate a failure.
I own requirements, metric definitions, product structure, design reviews, and acceptance feedback, with AI assisting implementation, tests, and handover documentation. Acceptance exposed a gap: the page counted errors, but the original error, stack, and request context were insufficient for diagnosis. Work then extended the diagnostic path. The implementation described here is refactor revision aad88a6.
Counting errors and investigating them need different information
A rising error count shows that a problem is still occurring, but does not explain how to reproduce it. Opening one occurrence raises more questions: what was thrown, what happened before it, which request was involved, and which build was running? Those details determine where to investigate next. A message string alone cannot answer them.
Context has costs. Objects can be large, responses can be streams, and logged objects may change after logging. More detail increases browser processing, transport, storage, and access-control work. The design therefore has to preserve useful historical information while avoiding changes to application behavior.
The system therefore stores the fact that an error occurred separately from its diagnostic details. Facts feed statistics; details may be sampled, truncated, rate-limited, expired, or fail to persist. Losing access to a detail does not undo the error. Otherwise, reducing diagnostic capture would also reduce the apparent error rate.
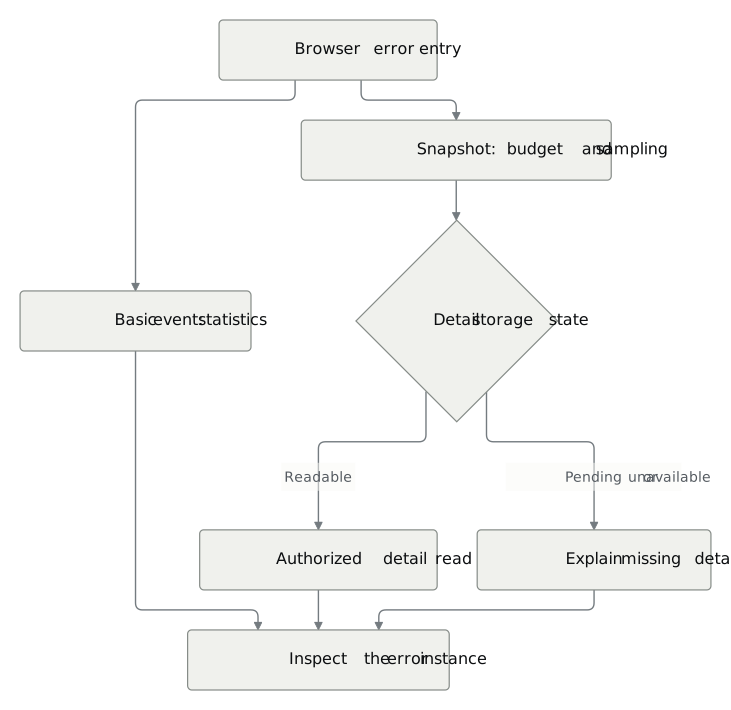
Scroll horizontally if needed.Open full-size diagramOpen full-size diagram
Follow one error through capture
Global exceptions, promise rejections, framework adapters, and explicit reporting converge at an error entry point. An extractor makes bounded snapshots of the exception and context. The ingestion API, Kafka, and consumer carry the event onward; the server stores basic facts and restricted details separately, and the page reads them by event.
A snapshot has two constraints. First, capture must not invoke a business getter or toJSON merely to serialize an object. Serialization could itself throw or mutate state. The implementation reads data properties through descriptors and limits nodes, depth, and serialized size, retaining reasons for unreadable fields. Second, console records need to reflect their logging time, and an error freezes the relevant preceding window. Later object changes must not rewrite that history.
For example, an application logs a state object, changes it, and then throws. Keeping only a reference could make the preceding log show the later value, changing the apparent event order. This is an explanatory example of snapshot semantics. Regression coverage also checks concurrency, navigation, and tracker destruction.
The code path is documented in the diagnostics maintenance guide.
Why the application supplies response text
A convenient-looking fetch wrapper could read the Response again and save its contents. But the body has consumption semantics, and application code may still need it. A streaming or unknown-length response cannot be assumed cheap to copy in full.
The implementation observes controlled fetch calls and accepts text the application has already read. The SDK does not call text() or json() again on the business Response, or use clone() or tee() to read a second stream in the background. This limits automatic completeness but avoids another read task solely for diagnostics. The application’s own reading cost still exists.
Suppose the page throws just after a request starts. Pending is the correct state for that diagnostic. The response and application-read body arrive later. The SDK may update the request record in the current page buffer, but the frozen, emitted error envelope must keep the state observed at the error. Request initiation, response arrival, body reading, and the error therefore remain distinct moments.
Body budgets also cannot be measured only in JavaScript characters. JSON escaping, UTF-8 encoding, and status metadata use space. The snapshot implementation finds a prefix within its serialized-size budget and avoids splitting a UTF-16 surrogate pair. It marks truncated values explicitly. The page can distinguish an empty body, text not supplied, unreadable content, and a retained prefix instead of leaving the reader to interpret a blank field.
The prefix-selection core of textEvidence is below, with returned metadata omitted. jsonBytes measures UTF-8 bytes after JSON serialization:
const reserve = 180;
let lo = 0, hi = Math.min(value.length, limit);
while (lo < hi) {
  const mid = Math.ceil((lo + hi) / 2);
  if (jsonBytes(value.slice(0, mid)) <= limit - reserve) lo = mid;
  else hi = mid - 1;
}
if (lo && /[\uD800-\uDBFF]/.test(value[lo - 1]!)) lo--;
const kept = value.slice(0, lo);
The search measures candidate prefixes and narrows the range. Its upper bound respects the field budget, keeping a large body from expanding the search without bound. It makes a conservative cut rather than treating characters as bytes or promising the longest prefix across every Unicode boundary. reserve leaves room for status metadata, and the trailing-surrogate check avoids retaining half a character. Record, collection, and envelope budgets still need checking: bounding one field does not guarantee admission of the whole event. This turns a general size limit into inspectable encoding and budget rules.
Temporal proximity provides a clue, not ownership
Several requests can overlap on one page, and the same named operation can be triggered twice. Joining by time or name alone can attach another operation’s request to an error.
The system associates explicit request, operation, and workflow instance identifiers. Without that evidence, it displays temporal proximity only. A local observation ID is not presented as a server request ID; further cross-system association requires the application to carry and return the relevant identity.
Workflow analysis additionally handles late and duplicate events. The reducer checks both occurrence time and receipt time before reconstructing an instance. Consider an illustrative event that occurs at 10:00 but arrives at 10:05. A query for knowledge available at 10:02 must exclude it. Filtering only by occurrence time would allow later arrivals to rewrite what the system knew then.
Repeated identical content under one event ID can be deduplicated; conflicting content under the same ID is rejected with a reason. Missing starts enter rejection records. Insufficient or conflicting instance evidence can yield unresolved states. Cohorts containing unresolved instances return no success rate, avoiding a precise-looking percentage that silently treats uncertainty as failure or drops it.
Source mapping starts with build identity
A minified filename, line, and column are useful for mapping only when the map matches the deployed build. A map for another file with the same name may produce a plausible location in the wrong source version.
Uploads are identified by project, release, build, and asset. JavaScript and map digests are checked, and conflicting content under the same identity is rejected. Queries use the matching private map through a bounded server-side parser; they do not automatically fetch URLs found in the stack.
Mapped information and the original compiled stack remain separate. Version mismatch, missing map, parsing failure, and a location without sourcesContent produce different states. Locating a file and line does not guarantee that a source excerpt is available. An explicit fallback reason makes the result easier to assess than source silently loaded from an unknown version.
The SourceMap implementation also handles upload credentials, authorization, expiry, and private-file lifecycle. Reading and exporting raw content require their respective permissions. Syntax highlighting uses text nodes; copying and export preserve the original text.
Explain where information became unavailable
“No stack” can result from several stages. Turning every case into an empty array leaves the reader unable to choose between fixing SDK setup, waiting for storage, uploading a map, or requesting access.
| Layer | Example state | Diagnostic meaning |
|---|---|---|
| Capture | truncated / unavailable | Content is incomplete or unreadable; absence of an original cannot be inferred |
| Storage | pending / write_failed / expired | The basic error exists, but detail is not yet readable, failed to persist, or expired |
| Parsing | partial / parse_failed | Original content remains; derived structure is incomplete |
| Access | forbidden | This identity cannot read the detail; it does not imply no data was stored |
With these states, pending directs the reader toward consumer progress, while forbidden points toward access permissions. A blank field no longer has to mean the SDK missed the data. Error counts still come from basic facts, independently of detail sampling, expiry, or parsing.
What verification establishes
Verification follows the same event through the browser, ingestion, consumer, storage, authorized API, and page. Fault scenarios include unusual stacks, response streams, late callbacks after navigation, revoked access, wrong build identity, and missing private files. Recovery runs in an isolated environment. These observations describe the tested behavior more clearly than a test count alone.
Performance figures in the D7 record use revision 709db4bb, a GitHub Ubuntu runner with 4 vCPUs and about 16.7 GB RAM, and containerized dependencies. At 200 diagnostic events/s for 10 seconds:
| Metric | Result | Timing boundary |
|---|---|---|
| Ingestion p95 | 52.89 ms | Response latency for ingestion requests |
| Diagnostic persistence p95 | 9,562 ms | Delay through asynchronous processing to persisted detail |
Fast acceptance does not imply immediately queryable detail. The gap motivates observing consumption and storage separately. This short synthetic workload checks behavior in that environment; it does not establish sustained capacity or a production ceiling. The record also gives 12,287 gzip bytes for the base SDK and 24,976 bytes for the full diagnostic combination. Optional modules keep basic integration smaller, while full diagnostics still have a measurable bundle cost.
The project is delivered. The user guide covers integration and operation, and the developer reading series (Chinese) follows the implementation. Deployment parameters, capacity, and retention still require verification in a new environment.
Continue by implementation topic
The reading guide (Chinese) organizes the implementation series by task. Start with event delivery and read models to understand missing data; continue with runtime diagnostics for error snapshots, requests, SourceMap and policy maintenance. These detailed articles are currently available in Chinese.